Find financially strong businesses before the market fully recognizes them. The Financial X-Ray combines financial health, management quality, growth and valuation into one structured stock rating to understand a company's true value.
Note: X-Ray selection is evaluated on a monthly basis. Stocks that no longer qualify are sold and the proceeds are reinvested. As a paid subscriber you'll have full transparancy on every trade and decision made.
Note: database is updated on a monthly basis.
An excerpt of a case study
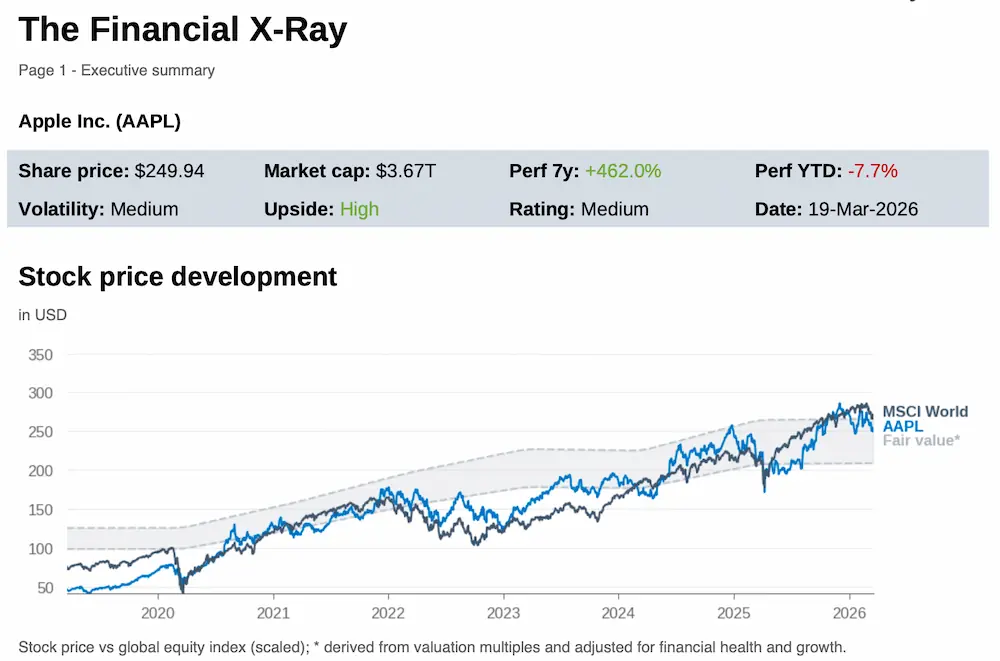

Stock vs. Market: Blue line = company. Grey line = global market (MSCI World). Light grey band = Fair value range
Shows whether the stock trades in a structurally supported range and outperforms a broad ETF benchmark.
7-Year Performance: Long-term value creation – filters out short-term noise. YTD: Current momentum and market sentiment.
Volatility: How strongly the stock swings versus peers.
Upside: Future price potential based on growth and valuation.
Rating: The overall verdict combining quality, growth, risk, and valuation.
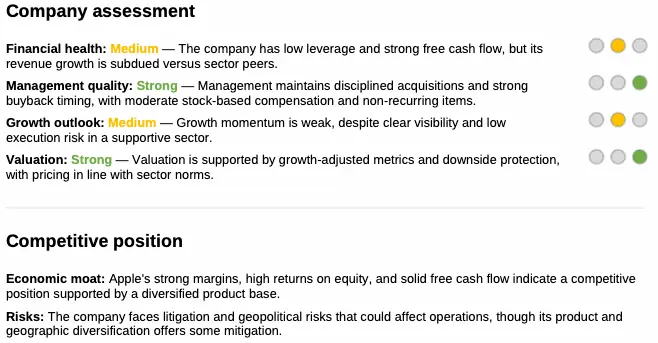
Each line is a verdict. The model combines dozens of metrics into weighted category scores.
Ratings are contextual. “Strong” doesn’t mean perfect. “Weak” doesn’t mean broken. Every score reflects both strengths and pressure points.
Economic Moat: shows durability. Are margins, returns, and cash flow strong enough to defend the business?
Risks: show vulnerability. Concentration, leverage, cyclicality, or external threats that could pressure results

...

This is the core financial dashboard. It shows the key numbers that define a company’s financial health.
If the business changes, it shows up here. Shifts in strategy, pricing power, cost control, leverage, or capital allocation eventually appear in these metrics.
The interaction matters. Revenue without margin improvement, profit without cash flow, growth with rising debt – these patterns reveal direction.
Valuation is derived based on multiples typical for the sector and in context of defensibility (underlying health, growth, moat).
Each metric is judged on more than one dimension: level, trend, stability, durability, and consistency over time.
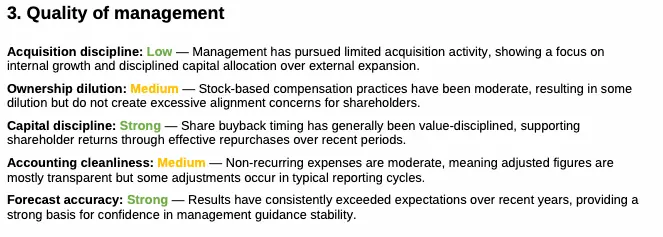
This section measures how management handles shareholder money and what it reveals about quality.
Acquisitions & ownership: Are acquisitions selective and stock-based compensation controlled?
Capital allocation: Are buybacks timed intelligently and value-focused?
Transparency & reliability: Are earnings clean, and does management meet its guidance?

Opportunities vs. Risks: What can drive the stock higher – and what could knock it down?
Growth & Prospects: Is momentum sustainable, or dependent on perfect execution?
Peer valuation chart: Shows how expensive the stock is relative to competitors. Above peers = higher expectations and growth priced in. Below peers = lower expectations and growth (or potential undervaluation).
Summary: It highlights the decisive forces and evaluates what drives the investment case, and what holds it back.