Expensive Mistakes

Most investment mistakes are not caused by a lack of information. They happen when investors interpret information incorrectly. These recurring patterns show how revenue growth, margins, valuation, debt and business quality can send misleading signals when viewed in isolation.

X-Ray a stock

Same data. Different conclusion.

The same inputs can produce very different conclusions, depending on how they are structured.

News paper headlines flagging revenue growth for companies
“Revenue Accelerates to Double-Digit Growth”
“Strong Demand Momentum Across Segments”
Icon showing a stock pattern under investigation

What most investors infer

Huge demand, the business must be getting stronger.

Icon showing an integrated system when analysing stocks

What actually matters

Revenue measures expansion, not quality. Only if cash generation and returns on capital improve, the business is getting stronger.
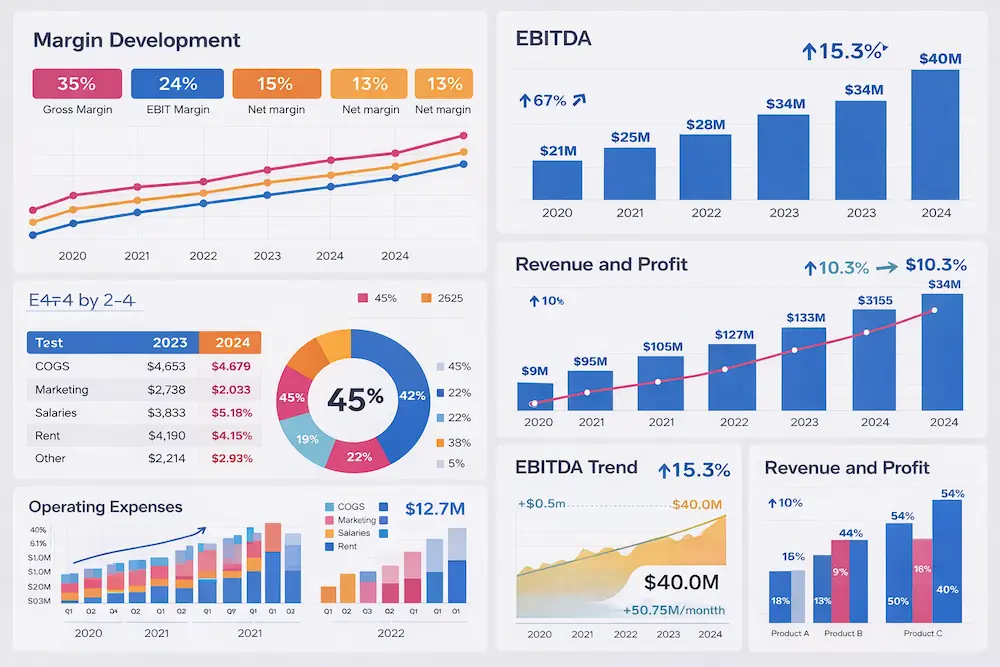
Detailed financial performance dashboard displaying margin development, EBITDA trends, cost breakdowns, segment profitability charts, and multiple bar and line graphs.
“Margins Expand to Record Highs”
“Cost Discipline Boosts Earnings”
Icon showing a stock pattern under investigation

What most investors infer

Higher margins mean a better business.

Icon showing an integrated system when analysing stocks

What actually matters

High margins don’t guarantee durability. What matters is whether strength holds and not whether it spikes.
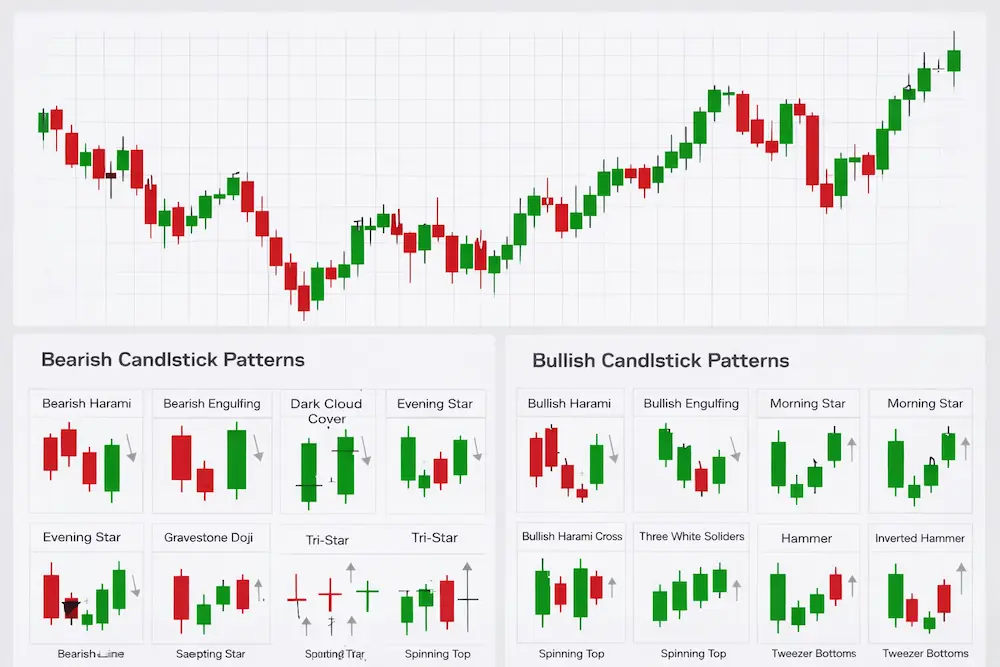
Stock price candlestick chart showing long-term price movement above smaller candlestick pattern examples for technical analysis comparison.
“Shares Rally on Strong Momentum”
“Technical Strength Signals Further Upside”
Icon showing a stock pattern under investigation

What most investors infer

The market sees something positive. Now is a good time to buy.

Icon showing an integrated system when analysing stocks

What actually matters

Price reflects sentiment, not business quality. Long-term, both converge.

An exerpt of recurring financial patterns investors often misread

Revenue, margins, cash flow, debt, and capital allocation consitently interact inside a business.

01

Why can revenue growth hide cash problems?

The phenomenon is called

CASH CONVERSION FRACTURE
Revenue scales and cash does not

Severity
High
Frequency
Common
Read more ›
02

Why can rising profit margins hide weakening business quality?

The phenomenon is called

MARGIN EXPANSION ILLUSION
Profitability improves while economic quality erodes

Severity
Medium
Frequency
Common
Read more ›
03

Why can rising earnings per share mask a weak business?

The phenomenon is called

SHARE BUYBACK DISTORTION
Earnings per share improve without business improvement

Severity
Medium
Frequency
Common
Read more ›
04

Why can a cheap stock be a warning for investors?

The phenomenon is called

VALUATION COMFORT TRAP
Cheap multiples conceal structural weakness

Severity
High
Frequency
Common
Read more ›
05

Why can a strong balance sheet hide operating weakness?

The phenomenon is called

BALANCE SHEET MIRAGE
Strong equity base hides operating fragility

Severity
High
Frequency
Common
Read more ›
06

Why can slowing growth still signal a healthy business?

The phenomenon is called

GROWTH NORMALIZATION PARADOX
Healthy deceleration mistaken for deterioration

Severity
Medium
Frequency
Common
Read more ›
07

Why can rising debt be dangerrous while performance stagnates?

The phenomenon is called

LEVERAGE DRIFT
Debt increases quietly while returns stagnate

Severity
High
Frequency
Common
Read more ›
08

Why can consistent results hide a lack of real progress?

The phenomenon is called

STABILITY OVERCONFIDENCE
Consistent results mask lack of progress

Severity
Medium
Frequency
Common
Read more ›
09

Why can strong margins and stable revenue hide rising execution risk?

The phenomenon is called

CAPEX SHOCK
High operating quality masks rising capital absorption

Severity
High
Frequency
Occasional
Read more ›
10

Why can strong performance create hidden valuation risk?

The phenomenon is called

DURABILITY OVERPRICING
Peak performance gets priced as permanent structural strength

Severity
High
Frequency
Common
Read more ›
See how the Financial X-Ray flags these signals
Every company report is built to highlight stregths and pain points accross financial health, growth, valuation and management quality.
View

Financial pattern library

The above-mentioned financial patterns are part of a larger pattern library. Find teasers and explantions on more recurring patterns that cause stock prices and true value to diverge.

Profitability Quality

Margin Fragility

Revenue grows while the cost base expands faster, compressing long-term profitability.

Structural Focus

Cost scaling, reinvestment intensity, cash conversion

Context

Platform, software, and growth-driven business models

Stability Overconfidence

Reported stability persists as reinvestment and internal momentum decline.

Structural Focus

Reinvestment rates, capital returns, organic growth capacity

Context

Mature consumer and service businesses

Earnings–Cash Decoupling

Reported profits improve, but the business does not generate more cash.

Structural Focus

Profit–cash gap, revenue recognition timing, cash realization

Context

Businesses where profits rise faster than cash flow over time

Operating Leverage Mirage

Margins appear poised to expand, but growth requires proportional reinvestment that caps profitability.

Structural Focus

Incremental margins, reinvestment elasticity, cost scalability

Context

SaaS, marketplaces, growth-stage platforms

Cost Absorption Illusion

Fixed costs look leveraged during growth but quickly reassert themselves when demand normalizes.

Structural Focus

Fixed vs variable cost mix, breakeven sensitivity

Context

Cyclical and semi-cyclical operating models

Reinvestment Drain

Profitability holds up while the cost of maintaining the business quietly rises.

Structural Focus

Maintenance capex, reinvestment rate, incremental returns

Context

Asset-heavy businesses, aging platforms, infrastructure-linked models

Capex Shock

Revenue and margins remain strong while capital expenditure surges and free cash flow weakens.

Structural Focus

Capital intensity, reinvestment burden, execution sensitivity, cash absorption

Context

Asset-heavy growth phases, infrastructure build-outs, manufacturing scale-ups, pharma capacity expansion, industrial expansion cycles

Capital Structure & Allocation

Buyback Distortion

Per-share metrics improve through financial engineering rather than operating progress.

Structural Focus

Share count dynamics, leverage usage, cash deployment

Context

Capital-return-focused companies with limited organic growth

Leverage Drift

Debt increases incrementally while returns remain stagnant.

Structural Focus

Balance-sheet flexibility, return on invested capital, funding dependency

Context

Late-cycle or slow-growth businesses

Capital Efficiency Collapse

Incremental capital generates declining returns despite stable headline profitability.

Structural Focus

ROIC trend, asset productivity, reinvestment quality

Context

Acquisition-led growth strategies

Cost Base Inflexibility

Costs rise easily with growth but do not fall when growth slows.

Structural Focus

Fixed costs, operating flexibility, margin sensitivity

Context

Businesses with heavy infrastructure, staffing, or platform overhead

Acquisition Momentum Bias

Revenue expansion via M&A is mistaken for economic improvement.

Structural Focus

Organic growth isolation, post-deal ROIC

Context

Roll-ups, fragmented industries

Valuation & Market Framing

Valuation Trap

Low valuation multiples reflect deteriorating business economics rather than mispricing.

Structural Focus

Return decay, reinvestment burden, downside exposure

Context

Asset-heavy and structurally challenged industries

Growth Normalization Misread

Healthy growth deceleration is interpreted as fundamental weakness.

Structural Focus

Absolute growth levels, margin stability, capital efficiency

Context

Post-hypergrowth business phases

Stability Overconfidence

Stable performance is priced as permanent despite weakening foundations.

Structural Focus

Competitive intensity, reinvestment needs, margin defense

Context

Consumer staples, branded incumbents, perceived “safe” compounders

Durability Overpricing

Exceptional performance is priced as permanent structural strength.

Structural Focus

Multiple expansion vs earnings growth, expectation risk, FCF yield compression

Context

High-growth, AI-driven, platform or turnaround businesses following sharp margin recovery

Balance Sheet & Cash

Cash Conversion Fracture

Business activity expands without proportional cash generation.

Structural Focus

Working capital dynamics, reinvestment burden, liquidity strain

Context

Operationally complex, fast-growing companies

Balance Sheet Mirage

Capital strength conceals underlying operating fragility.

Structural Focus

Cash volatility, operating leverage, earnings resilience

Context

Capital-intensive or cyclical businesses

Business Concentration & Durability

Apparent Diversification

Revenue appears diversified, but economic exposure is narrowly concentrated.

Structural Focus

Customer dependence, product reliance, geographic exposure

Context

Businesses with many revenue lines but a small number of true profit drivers

Growth and Demand

Market Size Delusion

A large market size is mistaken for proof that a company can actually win and hold meaningful share.

Structural Focus

Go-to-market friction, win rates, competitive intensity

Context

Enterprise software, fintech, vertical platforms

Phantom Revenue Pipeline

Reported backlog is treated as guaranteed revenue, even though customers can delay, cancel, or renegotiate.

Structural Focus

Backlog-to-revenue conversion, customer flexibility, delivery limits

Context

Industrials, infrastructure, long-cycle services

Pull-Forward Confusion

Temporary demand is mistaken for durable adoption.

Structural Focus

Cohort behavior, reorder rates, demand timing shifts

Context

Consumer goods, hardware cycles, post-stimulus growth

Growth Quality Substitution

Headline growth replaces analysis of where growth is actually coming from.

Structural Focus

Price vs volume mix, customer concentration, discounting

Context

Consumer brands, enterprise expansion, usage-based models

Cash Flow & Earnings Quality

Accrual Comfort

Earnings growth is trusted despite weakening cash realization.

Structural Focus

Profit–cash divergence, working capital intensity

Context

Fast-growing, operationally complex businesses

Deferred Reality

Cash inflows are pulled forward while obligations accumulate off-period.

Structural Focus

Deferred revenue, prepaid demand, future service burden

Context

Subscription, project-based, or promotional models

```

When numbers interact, the picture changes

When financial health, growth, valuation and management quality are reconciled, hidden trade-offs become visible.

Surface strength can hide weakness

Margins can improve while cash generation weakens.

Cheap does not mean undervalued

Low multiples often reflect weakening fundamentals rather than opportunity.

Growth can destroy value if quality erodes

Expansion without capital discipline weakens long-term business quality.

↑ Back to top